Difference between revisions of "Spectrum"
m (→Usage) |
(→External resources) |
||
| Line 187: | Line 187: | ||
===External resources=== | ===External resources=== | ||
| − | [https:// | + | [https://fsplaces.fs.fed.us/fsfiles/unit/wo/emc/imi/IMI_OPEN_TeamRoom.nsf/1ba02e5ee0ba987c8525663a006cb7ec/9d6ec3fa57ddc68f8725711d007210b7?OpenDocument Spectrum web site] |
Revision as of 02:58, 18 December 2010
General System description
System name: Spectrum
Brief overview
Spectrum is a linear programming based model designed to schedule management treatments to achieve ecosystem management and financial, or other goals. Model formulation is flexible, allowing representation of simple and complex environmental interactions.
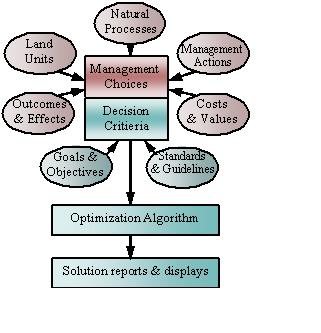
In a Spectrum model a user constructs a representation of natural processes and possible management actions on a landscape. They also construct a representation of decision criteria in the form of management objectives and physical constraints. A linear programming solver chooses the best mix of management options to meet specified goals and objectives.Contents
Scope of the system
System origin
Spectrum is based on the FORPLAN system developed by Dr. K. Norman Johnson and colleagues at Utah State and Colorado State Universities, and the members of the U.S. Forest Service (USFS) WO-LMP Systems Application Unit (now EMC-PAG) in Fort Collins, Colorado. FORPLAN Version 1 was developed in 1980, followed by FORPLAN Version 2 in 1983. FORPLAN became the "required primary analysis tool" for the development of National Forest land management plans by the USFS.
In 1991 the USFS Rocky Mountain Forest and Range Experiment Station, in cooperation with the USFS Ecosystem Management Analysis Center, moved the current UNISYS mainframe release of FORPLAN to the microcomputing environment and discontinued development efforts for the mainframe environment. These two groups collaborated in the development of Spectrum. Spectrum was designed to have a graphical user interface; execute on PCs; retain FORPLAN analytical capabilities with expanded modeling options and size limits; and provide new analytical capability to address ecosystem management issues.
The Spectrum system is available for no charge to the public. It does require the use of a commercial LP solver software, and uses the MPSIII system from Ketron Optimization.
Support for specific issues
Spectrum is a flexible modeling system that can be used for a variety of land management planning problems.
Support for specific thematic areas of a problem type
Spectrum is useful for a wide range of applications:
- Forest Plan amendment and revision
- Landscape/watershed scale analysis
- Designing sustainable management strategies
- Land and resource allocation
- Estimating levels of goods and services
- Finding pathways to desired conditions
- Management activity scheduling
- Environmental effects analysis
- Economic analysis
- Tradeoff analysis
- Sensitivity analysis
- Policy analysis
Capability to support decision making phases
(Click here to see a more detailed explanation)
- Intelligence
No specific functionality for this phase
- Design
Spectrum offers extensive automation in the generation of management options for land units. It also offers automation for the creation of objectives and constraints to be applied to any sub-unit of the forest, for any portion of the planning horizon.
- Choice
Spectrum offers many objective function formulations for the linear programming problem.
- Monitor
No specific functionality for this phase
Related systems
Spectrum has a custom utility to import data from the USFS Forest Vegetation Simulator (FVS).
Data and data models
Typical spatial extent of application
The spatial scale for a Spectrum model is user defined. USFS models are usually constructed for an entire National Forest which can be one hundred thousand to four million acres in size. In these models, analysis units are usually discontiguous parcels of land with similar attributes. Other uses of Spectrum are more tactical, modelling management options on thousands of acres with analysis units representing contiguous management parcels.
Forest data input
Spectrum is a modeling system and contains no data itself. Land units are described with up to six user defined attributes. Management actions are also user defined and are assigned as a management option to land units. Most forest outputs are input as forest strata level growth and yield tables. These tables can contain any number of metrics. Management actions are described as a series of activities that occur through time. Other outcomes and effects are calculated in quantitative relationships with these primary outputs and management activities. Natural processes are represented by state variables related to activities and outputs as they change through time. All activities and outputs may have associated costs and revenues.
Management objectives are represented as controls on levels of activities, outputs or states through time. These controls are input as simple equations that control the absolute level of a variable, the relative value of a variable to another or the relative change in a variable's value from one period to another.
Most bulky data sections have utilities that allow import from comma-delimited files. A special import utility allows import from the Forest Vegetation Simulator (FVS).
Type of information input from user (via GUI)
As a modeling system, Spectrum contains no data. The user enters all data via a user interface. Import utilities are employed to take large data pieces, like yield tables and analysis unit lists, from comma-delimited files. A special import utility is used to import yield information from the USFS Forest Vegetation Simulator (FVS). All data are stored in dBase type data tables, so advanced users can manipulate data with other database applications such as MS Access.
Models
Forest models
Spectrum is designed to import forest growth information from other forest models. A general import format is supported along with a custom utility for import from the Forest Vegetation Simulator.
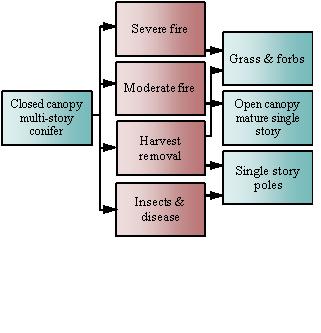
Spectrum also provides a modeling structure for representing natural disturbance and ecological simulation:
- Probabilistic mortality
- State, flow and accessory variables for ecological process simulation
- Decision tree for modifying successional pathway
- Spatial relationships and dynamics
These formulations are supported by a generalized Model 2[1] structure in the LP matrix.
Social models
Decision Support
Definition of management interventions
All traditional silvicultural treatments can be represented. Yield table representations of treatments from growth and yield simulators can be imported. Also, from a single yield table representing natural growth, many harvest timing options can be generated with harvests represented as a proportion of the inventory. Other activities associated with treatments can be generated with time, age or sequence relationships to forest outputs.
There is a great deal of functionality for creating many management options with minimal data redundancy.
Typical temporal scale of application
Spectrum can represent 90 time periods or steps of user-defined length. The most typical use is for long range planning of 150 to 200 years using 10-year periods. Five-year and one-year time steps have also been used.
Types of decisions supported
Spectrum is a flexible modeling tool that can be used to answer a wide range of planning questions:
- What is the Long Term Sustained Yield Capacity (LTSYC) of the forest?
- What are the likely timber production amounts and what silvicultural systems will be used?
- What will the forest look like in 100 years under a management scenario?
- Are desired conditions feasible?
- How long to reach desired conditions?
- What are the tradeoffs between desired conditions?
Decision-making processes and models
Spectrum is a linear programming based system. It offers great flexibility in the types of objective function formulations that can be constructed.
- Maximization
- Minimization
- Iterative Max or Min - maximize X then maximize Y subject to level achieved for X
- Goal programming
- minimize deviations above targets
- minimize deviations below targets
- minimize deviations above or below targets
- minimize deviations from a relative target (variable X should be close to 5% of variable Y)
- MAX/MIN[2] - maximize the minimum occurrence of a critical resource
- MIN/MAX - minimize the highest level of occurrence of a undesirable outcome
Output
Types of outputs
The Spectrum report writer interprets the results of a "solution" and can produce outputs in several forms:
- Formatted reports for a variety of model outputs to user defined summary level (forest-wide, sub-unit etc.)
- Comma delimited files with the same content and flexibility of formatted reports.
- Database tables (dBase format) with fine-grained results that can be queried and aggregated in the Spectrum Report Template.
Spatial analysis capabilities
Abilities to address interdisciplinary, multi-scaled, and political issues
System
System requirements
Spectrum requires the following operating system and support software:
- Windows 98, Windows 2000, Windows XP (untested on Windows Vista, Windows 7)
- C-Whiz linear programming solver by Ketron for solving models,
- Adobe Acrobat Reader, V6.x or greater for viewing help files,
- Text file viewing software such as Notepad or Wordpad
Spectrum continues to be maintained by the U.S. Forest Service
Architecture and major DSS components
Spectrum is a desktop application that runs in Windows operating systems. It requires the use of a commercial LP solver software and uses the MPSIII product from Ketron Optimization. Data are input into the system via forms or imported from comma-delimited files. Model results are output in a variety of forms: formatted reports, comma-delimited files or dBase tables.
Usage
Spectrum is used by government, industry and research[3] entities.
Computational limitations
- The planning horizon can be up to 90 periods of any length.
- There are no limits to the number of analysis units that can be represented.
- There are a small number of model parameters that have limits - see the user guide for details.
User interface
Spectrum has a fully functional user interface in which all the tasks of model editing, matrix generation, LP solving and solution interpretation can be accomplished. Formatted reports can be viewed from the interface, but complex graphing and reporting of results are done with spreadsheet or database software.
Documentation and support
Spectrum has a full electronic user guide in .PDF format. The user interface has context sensitive links to that user guide. The USFS Planning Analysis Group in Fort Collins, Colorado, provides user support for Spectrum to USDA Forest Service employees. Others can use the contacts below to inquire about support options:
- Mail can be addressed to:
- Planning Analysis Group
- USDA Forest Service
- 2150 Centre Ave., Bldg. A
- Fort Collins, CO. 80526
- Attn: Spectrum
- E-Mail can be addressed to: bmeneghin@fs.fed.us
Installation
The Spectrum Overview provides a good introduction to Spectrum.
The Spectrum installation package contains example tutorial models with annotations in the model description. You can contact Ketron for a trial version of the MPSIII solver and pricing.
Spectrum requires general knowledge of forest management and knowledge of linear programming techniques [4].
References
Cited references
- ↑ Johnson, K. Norman, and Scheurman, H. Lynn. Techniques for Prescribing Optimal Timber Harvest and Investment Under Different Objectives - Discussion and Synthesis. 1977. Forest Science Monograph.
- ↑ HOF, J.G., J.B. PICKENS, AND E.T. BARTLETT. 1986. A MAXMIN approach to nondeclining yield timber harvest scheduling problems. For. Sci. 32(3):653–666.
- ↑ Bevers, Michael and Hof, John. 1999. Spatially Optimizing Wildlife Habitat Edge Effects in Forest Management Linear and Mixed-Integer Programs. Forest Science 45(2): 249-258
- ↑ Kent, Brian M. 1989. Forest Service Land Management Planners' Introduction to Linear Programming. USDA Forest Service, Rocky Mountain Forest and Range Experiment Station, General Technical Report RM-173, Fort Collins, CO.


